
At FOSS Asia 2026 (Mar 8-10, Bangkok), note 2:
Charly Batista (Principal Product Solutions Engineer at EDB) gave a talk titled “Performance Without Magic: How Open Source Databases Scale.” It covers both PostgreSQL and MySQL, but I’ll focus on the PostgreSQL side here.
What makes this talk stand out: it doesn’t just list tuning knobs. It gives you a mental model for thinking about database performance systematically.
The core idea#
The biggest performance wins almost always come from removing unnecessary work — not from hardware or configuration.
The common mistake: your database is slow, so you “just tune your queries,” “add more RAM,” “throw it in the cloud,” or “increase max_connections.” These are all shots in the dark.
The right approach:
- Understand why it’s slow
- Build a mental model of the engine
- Make targeted, measurable changes
- Know when to buy hardware
The Performance Stack#
The talk introduces a hierarchy of where bottlenecks can live:
Hardware → File System → OS/Kernel → DB Engine Config → SQL & Query Design → Application/ORMThis is the key insight: tuning the wrong layer wastes time and money. Buying a bigger server instead of adding a missing index. Tweaking kernel parameters when your ORM is generating N+1 queries. You need to identify which layer is the bottleneck first.
Indexes: not free, but essential#
- B-Tree (default), Hash, GIN (JSONB/arrays), BRIN (time-series), GiST (geo)
- Every write pays a cost for each index
- Index columns you filter, join, or sort on — not columns you SELECT
- Composite index order matters
- Covering indexes can eliminate the most expensive operation: random I/O to the heap
Memory tuning#
Everything hot should live in RAM.
| Parameter | Recommendation |
|---|---|
shared_buffers | 25% of RAM (don’t set > 40%) |
effective_cache_size | 50–75% RAM |
work_mem | 16–64 MB global, raise per-session for heavy queries |
maintenance_work_mem | 1–2 GB for autovacuum |
A bad sign in EXPLAIN ANALYZE: Sort Method: external merge Disk: 87456kB — this means work_mem is too low for that query. But be careful: work_mem is allocated per sort/hash node, per query, per connection. Keep the global value low and raise it per-session for known heavy queries.
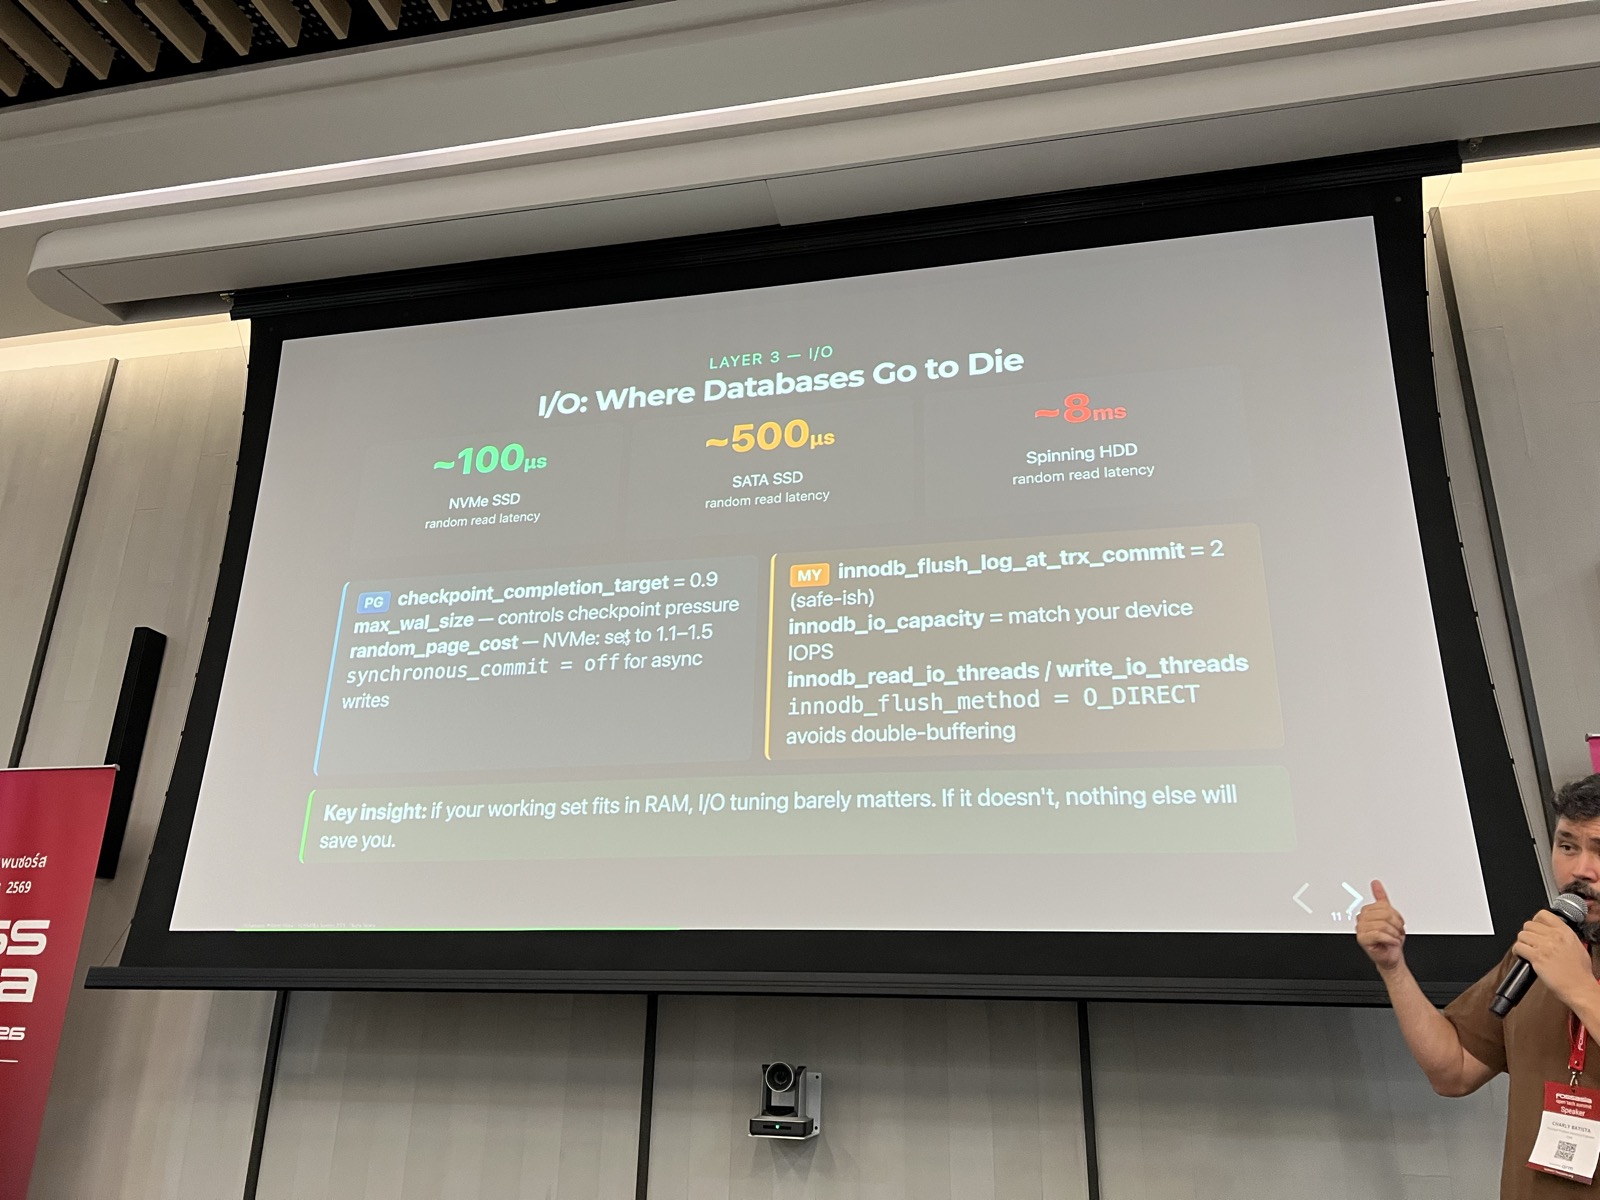
I/O: where databases go to die#
If your working set fits in RAM, I/O tuning barely matters. If it doesn’t, nothing else will save you.
Random read latency comparison:
- NVMe SSD: ~100us
- SATA SSD: ~500us
- Spinning HDD: ~8ms
Cloud storage (EBS gp2, standard) can have 5–10x worse I/O latency than local NVMe. Know your instance type.
Linux kernel settings that matter#
Several OS-level settings can make or break database performance:
Swap: vm.swappiness = 1 — don’t swap under databases.
Transparent Huge Pages (THP): Disable them. THP defrag can stall DB processes for hundreds of milliseconds — invisible in query plans. This applies to both PostgreSQL and MySQL.
echo never > /sys/kernel/mm/transparent_hugepage/enabled
echo never > /sys/kernel/mm/transparent_hugepage/defrag
I/O Scheduler: Setting the wrong scheduler on NVMe can halve your IOPS. Use none or mq-deadline for NVMe/SSD.
Connections are not free#
Each idle PostgreSQL connection costs ~5–10 MB RAM. 500 idle connections = 2.5–5 GB wasted.
Rules:
- Never set
max_connections> 200–300 without a pooler - Connection storms are a real outage pattern
- Poolers (PgBouncer, PgPool-II, Odyssey) are infrastructure, not optional
Busting performance myths#
Several myths from the talk that I see regularly:
- “More RAM always fixes slow queries” — If your query lacks an index, no amount of RAM eliminates full-table scans.
- “Increasing max_connections handles more users” — More connections increase contention and memory pressure. Use a pooler.
- “SELECT * is fine” —
SELECT *prevents covering index scans, inflates network/memory, and breaks query plans. - “The cloud is faster” — Cloud storage can have 5–10x worse I/O latency than local NVMe.
Reading query plans#
Look for these red flags in EXPLAIN ANALYZE:
Seq Scanon a large table — missing index?Rows=10000 vs actual rows=3— stale statistics, run ANALYZEBuffers: shared hit=0 read=8000— cache miss, I/O boundSort Method: external merge Disk— raise work_mem
pg_stat_statements is your production profiler. After large batch imports, always run ANALYZE.
Software vs hardware: a decision framework#
Try software first if:
- Sequential scans on large tables (add index)
- High CPU with low iowait (optimize query)
- Cache miss rate > 5% (tune buffer pool)
- Stale statistics / visible bloat
- Excessive connections (add pooler)
Invest in hardware when:
- Disk is 100% utilized and queries are already optimal
- Working set fundamentally won’t fit in RAM
- Write throughput exceeds what NVMe can deliver
Hardware upgrade priority: Storage > RAM > Network > CPU
The key point: hardware scales linearly at best. A bad query can eat orders of magnitude more resources than a good one.
Key takeaways#
- Measure before you tune. Use
EXPLAIN ANALYZE,pg_stat_statements, slow query log. - Fix the query first. A missing index can be 1000x faster than any config change.
- Right-size memory. Buffer pool hit rate should be >= 95%.
- Connections are threads/processes. Use a connection pooler.
- Storage is often the real bottleneck. NVMe for OLTP, always.
- OS tuning is not optional. THP, swappiness, I/O scheduler matter.
- Maintenance keeps performance. VACUUM, ANALYZE, statistics.
- Hardware buys headroom, not fixes. Buy it when software is maxed out.
- The stack matters. Tune the right layer, in the right order.
Links#
- Slides: https://elchinoo.github.io/fossasia-2026/
- Author: Charly Batista (EDB)
- https://eventyay.com/e/88882f3e