
At FOSS Asia 2026 (Mar 8-10, Bangkok), note 5:
There was a talk about SQL Expressions — a new feature in Grafana 12 that lets you transform and combine query results using SQL syntax.
The problem#
Grafana has always had two ways to transform query data, and the distinction is confusing:
- Server-side Expressions — run by Grafana backend, simple math (
is_nan(),+,max(),/), can be used in alerting rules and visualizations - Transformations — run in the browser, support complex operations like joins and field selection, but can only be used for visualizations (no alerting)
So if you needed anything beyond simple math in an alert — you were stuck.
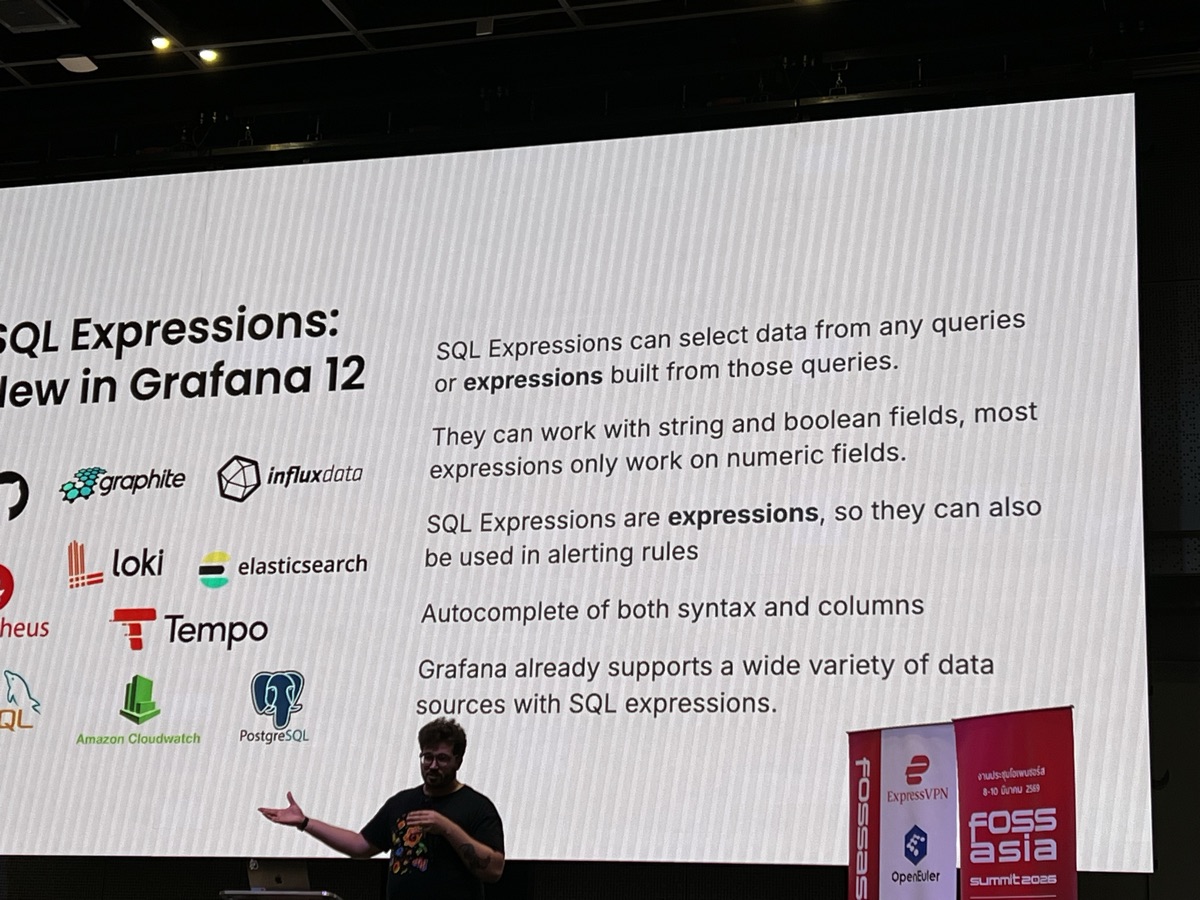
SQL Expressions#
SQL Expressions bridge this gap. They run server-side (like expressions) but support SQL syntax (like transformations) — including SELECT, WHERE, JOIN, GROUP BY, and string/boolean operations.
Key points:
- Use MySQL-like syntax (powered by go-mysql-server from Dolthub)
- Can query results from any data source — Prometheus, Loki, Elasticsearch, PostgreSQL, etc. — as if they were tables in the same database
- Work with string and boolean fields (regular expressions only work on numeric fields)
- Can be used in alerting rules — this is the big one
- Autocomplete for both syntax and column names
Cross-source joins#
The most interesting part — you can join data from completely different sources. Prometheus metrics + MySQL tables + Google Sheets in one query. No ETL pipeline, no data warehouse, just SQL.